
Post-2015 Consensus: Food Security and Nutrition Assessment, Rosegrant et al
Assessment Paper
Summary of the targets from the paper
| Food Security and Nutrition | |||||
|---|---|---|---|---|---|
| Targets | Benefits ($B) | Costs ($B) | Benefit for Every Dollar Spent | ||
| Reduce post harvest losses by 10 percentage points | Globally | $4,051 | $299 | $14 | |
| Developing World | $3,072 | $239 | $13 | ||
| Increase investment in agricultural R&D by 160% | $2,961 | $88 | $34 | ||
Summary of the targets from the paper
Summary
The 2008 and 2011 food price spikes sparked concerns about whether the growing global population would be able to feed itself in years to come, and with this came a renewed increase in interest in the level of postharvest losses (PHL)and the potential to improve food security by reducing them. It has been estimated that an additional one billion people could be fed if food crop losses were halved, which could potentially relieve some of the pressure on the significant increase in production that would be required.
One way to address food security in developing countries is to ensure the inclusion of infrastructure development and technology improvements in postharvest best practices. However, the extent to which reductions in PHL can cost-effectively improve food security is unclear, and there is a need to understand the existing and potential investments and technologies that affect losses, and their cost-effectiveness. In this paper, we seek to better understand the levels of investment required to effectively reduce PHL.
Postharvest losses and responses
Most papers on this topic focus on four aspects: 1) estimates of the magnitudes of losses; 2) the economic impacts of losses in general but also on the poor and the hungry in particular; 3) alternative ways to decrease losses through the use of both new and traditional technologies; and 4) the economic costs of losses as well as their remedies. Unfortunately, there is little agreement on either the magnitude of the problem or the relative benefits of various means to tackle it. Even from a global perspective, estimates of total losses fall within a wide range (10-50%).
This difficulty in measurement is felt particularly in developing countries, where the problem of losses is the most severe. There are huge discrepancies and year-to-year variations even within estimates of specific crops in particular countries or regions. Estimates from the African Post Harvest Loss Information System, for example, range from 10 to 20%, which is well below the 40-50% frequently cited in the development community. In another case, estimates of rice losses in Southeast Asia are in the range 37-60%, while extreme cases in Vietnam are estimated to result in 80% of production being lost. But a more comprehensive estimate puts rice losses in Asia at just 13-15%.
A related problem in the estimation of losses is their de-facto economic impact, which also varies dramatically by region and country. In Africa, cereal losses amount to approximately $4 billion out of a total production value of $27 billion. In the United States, the economic value of food loss at the retail and consumer levels is estimated to have been $165.5 billion in 2008. Part of the problem is that the types of losses are different. On-farm, value chain and consumer losses constitute entirely different problems in themselves, even if they are interrelated.
One important factor to take into consideration in this discussion is how much of a reduction is actually feasible or realistic and at what cost these goals can be achieved. As part of the UN “Zero Hunger Challenge” announced in 2012, one of the five pillars to achieving this goal was to achieve zero food waste. Not only is this target unrealistic and impossible to achieve in practice, but resources used might better be used to eradicate hunger in other ways. A cost-benefit analysis is needed to find an acceptable level of loss for different commodities and environments.
Various technologies exist to help reduce losses in the different postharvest stages, and the potential gains from each need to be measured against their costs of adoption. For example, on-farm technologies for storage of roots, tubers and bulbs increase profit 2.5 times compared to non-adoption. Cooling practices used for vegetables can provide gains worth up to 7.5 times the initial costs. However, some of these technologies are scale-dependent, so limiting their availability to small farmers. Also, some incur additional costs for labor and capacity building, which may reduce their overall profitability.
However, in many cases, adoption of new technologies is often slow, and a key reason is the need for appropriate supporting infrastructure. Recent significant increases in the adoption of cold storage in the Indian state of Bihar, for example, have been made possible by the improvement of the physical and social infrastructure. Not only have recent governments in the region put in place better public provision of services and policy reforms, they have also invested in roads and infrastructure, thereby increasing the ability of farmers in remote areas access markets.
Methods
The relationship between PHL and infrastructural variables can be modeled via grouped logistical regression using an Ordinary Least Squares (OLS) approach, as issues of endogeneity are not present at a country level. We have applied a weighted grouped logistic approach in which the logit transformation is applied to the dependent variable. By combining these results with unit cost data for each of the relevant infrastructures, we derived the required levels of investments needed to reduce losses by 5, 10 and 25 percentage points.
The International Model for Policy Analysis of Agricultural Commodity and Trade (IMPACT) is a partial equilibrium, multi–commodity, multi-country model which covers 56 crops and livestock commodities. It includes 159 countries/regions where each country is linked to the rest of the world through international trade, and 320 food producing units (grouped according to political boundaries and major river basins). This model generates long-term projections of food supply, demand, trade, and prices that enable us to estimate the trends in global food security between 2010 and 2050. IMPACT also computes food security indicators such as the number of malnourished children under five and the population at risk of hunger.
Four PHL scenarios were run to simulate the effects of potential improvements in harvest technologies and transportation infrastructure that would allow for a larger percentage of what it planted actually reaching markets. The results for these scenarios were compared to the impact of increased agricultural research investments. All scenarios were run using the Intergovernmental Panel on Climate Change (IPCC) medium projection on socioeconomics (SSP2), and assuming a constant 2005 climate. The scenarios are summarised in the table.
Table 1 - Scenario summary
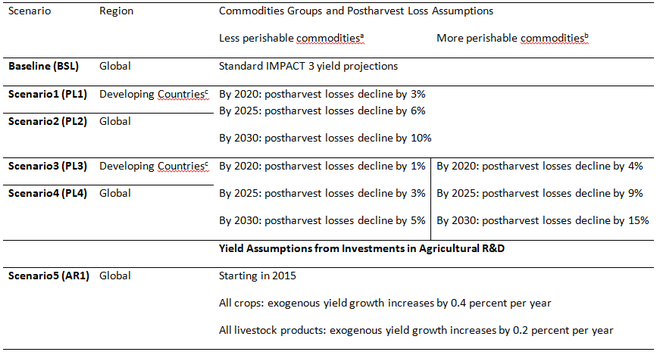
aCereals, Pulses, Roots and Tubers, Oilseeds, and Other Crops
bFruits, Vegetables, and Livestock products
Data and results
Data for 40 countries and four aggregates were collected for four types of losses: on-farm, value chain, consumption and total losses. Losses were also further classified by region and by type of crop. Six commodity groups were identified: cereals, roots, oilseeds, fruits and vegetables, animal (meat and dairy), and others.
Regions display fairly different averages depending on the type of loss. For instance, while consumption and on-farm losses are higher in developed countries, value chain losses are higher in developing countries. Africa displays the highest average losses for value chain and the lowest for consumption, which is expected given the continent’s lower incomes. The developed world displays a low average loss overall compared to developing regions. Fruits and vegetables dominate the on-farm losses by a considerable margin. Cereals, roots and oils seeds show similar percentages. Losses are also large in the value chain for fruits, as well as roots. On-farm losses by crop do not show much variation across commodity groups with the exception of losses originated from animal products, which are significantly lower.
A range of infrastructural variables are considered. These are: electric power consumption per capita, air freight, road density, road freight, percentage of paved roads, rail freight, mobile and fixed phone penetration, government stability and rural population density. Regression analysis then gives the odds ratios for each factor affecting PHL. The results provide support for the importance of roads, particularly paved roads, which reduce the odds of post-harvest losses by half. However, not all infrastructural variables have a positive impact, and no significant effects were found for the governance variable.
The investment needed for various reductions in PHL was estimated for four infrastructure categories: electricity, paved roads, rail capacity and road capacity. For Scenario 1, we assumed that the 10% decrease in PHL would be generated equally by each of the categories, resulting in a total investment of $415 billion. For Scenario 2, we assumed that reducing PHL in developed countries would be less expensive in terms of infrastructure investment given that the physical infrastructure is already in place (total investment of $515 billion). Scenario 3 considers the overall PHL reduction as an average of the individual losses for the three commodity categories, giving an overall investment of $485 billion. For Scenario 4, we added 25% to account for the investments in developed countries, giving a total investment of $605 billion.
Using the IMPACT model, decreases in PHL lead in almost all cases to lower commodity prices by 2050. The price decreases are mainly in the 10-20% range. Under the scenario of increased investment in agricultural research, price reductions for crops even are larger, with prices for most crops declining by more than 20% in 2050. Such changes in prices can have profound effects on both consumer and producer behavior. The increased availability of affordable food is expected to result in significant declines in the population at risk from hunger: for increased agricultural research, 21.2% in sub-Saharan Africa, 19.2% in South Asia, and 13.9% globally (70 million in total). Numbers of malnourished children would also be 5.5% lower globally (5 million), although the gains in this case would be greatest in Latin America and the Middle East/North Asia.
Price reductions are a straightforward benefit for consumers. Most farmers globally are net consumers of food and would benefit from lower prices. Nevertheless, prices decline can have a negative effect for producers if they are not compensated by increased productivity. We have therefore done a welfare analysis to quantify the impact on different sectors of society, using discount rates of 3, 5 and 10%. We find that total welfare is projected to increase 3-4%, although there is an overall negative effect on producers, who lose between 3 and 7.5% of their surplus. Developing countries get more than 80% of the global welfare gain in all scenarios.
The rates of return to investment in infrastructure and technologies that would lead to PHL reductions would likely have large benefits in other sectors of the economy, as expansion of roads, electricity, and railways benefit the economy more broadly than just the agricultural sector, whereas the scenario focusing on agricultural research investments targets primarily this sector, and would have relatively small spill-over effects on other sectors of the economy, so we assess rates of return for both full and reduced cost allocations (50% and 25%).
The PHL scenarios have benefit-cost ratios ranging from 6 to 15, depending on the discount rate assumption. At any given discount rate, there is very little difference in BCR across the four PHL scenarios, as scenarios with higher benefits are also characterized by higher costs. The BCR for the AR1 scenario is more than twice to more than three times higher than for the PHL scenarios, depending on the discount rate, ranging from 20 to 35. These ratios are only exceeded by those for other scenarios when only 25% of investment is allocated.
Conclusions
The premise of our work is that infrastructure is of primary importance in explaining post-harvest losses as well as in providing the enabling conditions for adoption of PHL-reducing technologies. Of critical importance is that poor infrastructure is a barrier to PHL reduction, and adoption of PHL-reducing technologies is facilitated by the development of improved infrastructure.
Results point to the important roles of electricity, roads (particularly paved roads), and railways in reducing PHL. Dummy variables also revealed significant difference across commodities and regions. For instance, roots and tubers, oilseeds and fruits all increase the probability of higher PHL relative to cereals. At the same time, regional dummies indicate that, relative to Africa, the probability of PHL is lower for all other regions. Infrastructure development is an essential enabling condition for achieving lower PHL.
The scenarios considered show that investment in infrastructure for PHL reduction contributes to lower food prices, higher food availability and improved food security, and has positive economic rates of return. Reductions in PHL are not a low-cost alternative to productivity growth for achieving food security. Rather, large-scale reduction in PHL requires large public investments and is complementary to investments in long-term productivity growth to achieve food security.