Research
A New Way to Compare Global Problems
How Much Have Global Problems Cost the World? A Scorecard from 1900 to 2050 asks some of the world’s top economists to quantify the damage caused from global problems such as poor health, biodiversity loss and wars from 1900 and till 2050. They compare this damage - on a regional and global level - to the total human wealth at that time to give a comparable sense of proportion across areas and across time. This essentially measures the problem in percent of world GDP.
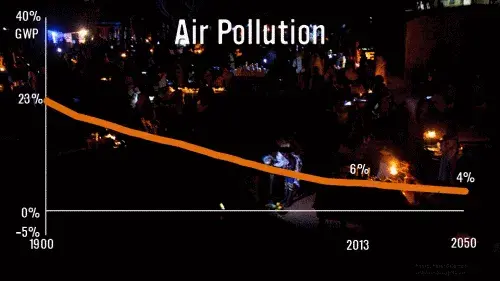
Air pollution
The biggest environmental problem in the world is, perhaps surprisingly, air pollution. Perhaps even more surprisingly, it has been declining for past 110 years. This is because most air pollution deaths are caused by indoor pollution from cooking and heating with dirty fuels. Over the 20th century, 260 million died from indoor air pollution in the Third World – about twice the toll in all the century’s wars. This is more than 4 times more than died from outdoor air pollution. As poverty has receded and clean fuels gotten cheaper, the risk has fallen eight-fold and will decline another 70% until 2050.
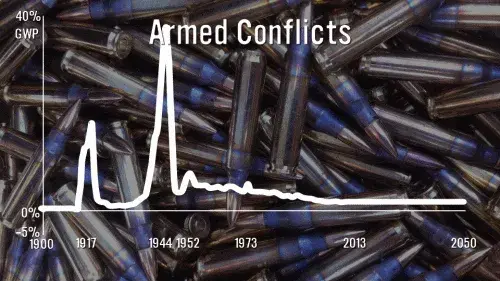
Armed conflict
War has a heavy economic and human cost. On average, the 20th century military cost about 5% of GDP per year. Yet, since the Korean war peak of 7%, global costs have declined steadily through 3.5% in 1980 to about 1.7% now. Even for a pessimistic outlook till 2050, this might only go up to about 1.8% -- and with a more optimistic outlook, it could decline further to 1.6%. The important takeaway is that the heavy military costs of the 20th century has been turned into what looks like a permanent peace dividend.
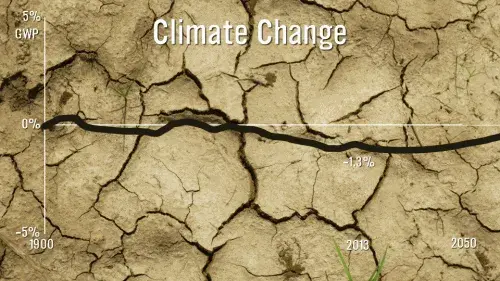
Climate change
Climate change is real and man-made. It will come as a big surprise that climate change from 1900 to 2025 has mostly been a net benefit, rising to increase welfare about 1.3% of GDP per year. Why? Because global warming has mixed effects and for moderate warming, the benefits prevail. The increased level of CO₂ has boosted agriculture because it works as a fertilizer and makes up the biggest positive impact at 0.8% of GDP. Likewise, moderate warming avoids more cold deaths than it incurs extra heat deaths. It also reduces the demand for heating more than increases the costs of cooling, totaling about 0.4%. On the other hand, warming increases water stress at about 0.2% and negatively impact ecosystems like wetlands at about 0.1%. Storm impacts are very small, as the total storm damages (including naturally caused storms) are about 0.2%.
As temperatures rise, the costs will rise and the benefits decline, leading to a dramatic reduction in net benefits. After year 2070, global warming will become a net cost to the world, justifying cost-effective climate action.
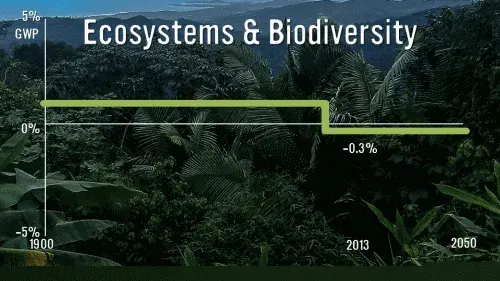
Ecosystems and biodiversity
Much has been written and said on the loss of biodiversity that we have been experiencing in recent decades. Species are estimated to be going extinct at rates 100 to 1000 times faster than in geological times. Moreover there is reason to believe that these extinctions are associated with economic and social losses. In some countries in Asia and Africa 80 percent of the population relies on traditional medicine (including herbal medicine) for primary health care. As extinctions continue the availability of some of these medicines may be reduced and new drug developments may well be curtailed. Yet, while we have a number of pieces of anecdotal evidence of this nature, and there are several studies that look at the value of biodiversity in specific contexts, no one has estimated the global value of the loss of biodiversity as such. This is because the links between biodiversity and biological systems and the economic and social values that they support are extremely complex.
Education
Illiteracy today afflicts 23.6% of the world's population. Yet, in 1900 perhaps 70% were illiterate. Only in the prosperous West, rapid increases in literacy were achieved early in the twentieth century. In developing countries, similarly large (and continuing), gains were made from 1970 to 2000, with the biggest improvements in China.
The costs of low education are substantial. Take Pakistan and Korea, which started with about the same level of education and income in 1950. Today, Korea has an average of 12 years education, whereas Pakistan has not yet reached 6. Korea’s per capita income grew 23-fold versus Pakistan’s 3-fold growth.
In order to compare across 150 years, the economists looked at the costs of illiteracy. In 1900, the cost of not having literacy was 12.3% GDP. Today, that number is close to 7%. By 2050, it is estimated illiteracy will reach about 4% and the cost will have dwindled to just 3.8% of GDP.

Gender inequality
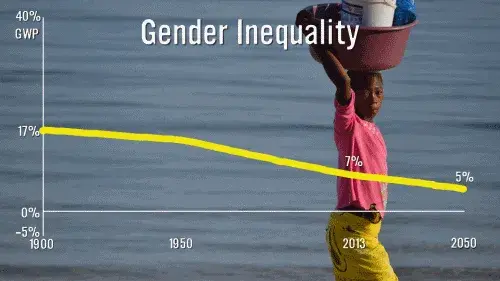
In 2012, women's lower salaries and exclusion from work cost the global economy a staggering 15.5% of GDP -- the difference between boom and bust. How did we get that figure?
The maximal estimate comes from looking at how much more women could have contributed to GDP, working as much as men and with the same pay. Deducted from this is the value of forgone (and unpaid) household work and the increased cost of female education.
In 1900, only 15% of the global workforce were women and even in 2012 it was still a less-than-even 40% earning only 60% as much as men. Even by 2050 the sex-ratio will not be even, and women will still make 30% less than men.
The research acknowledges that part of this may follow personal choices and not discrimination. In this medium estimate of gender inequality, the loss to the economy in 2010 is still estimated at 7%.
However, gender inequality is getting better, as the loss in 1900 was a substantial 17% of GDP. Projecting forward to 2050, that medium estimate suggests a 4% loss to the world economy.
Human health
One of the biggest improvements to the biggest number worldwide is in health. Life expectancy hardly changed before the late 18th century. Yet it is hard to overstate the magnitude of the improvement since 1900, from a life expectancy of 32 years to 69 now, to 76 in 2050. The biggest factor was the fall in infant mortality.
Take one overlooked example. In 1970, only some 5% of infants were vaccinated against measles, tetanus, whooping cough, diphtheria and polio. By 2000 it was 85%, saving about three million lives a year -- more, each year, than world peace would have saved in the 20th century.
Yes, childhood mortality is still high in sub-Saharan Africa but in 2008 was only a third of that of richer Liverpool in 1870. It is likely to drop by another 50% by 2050.
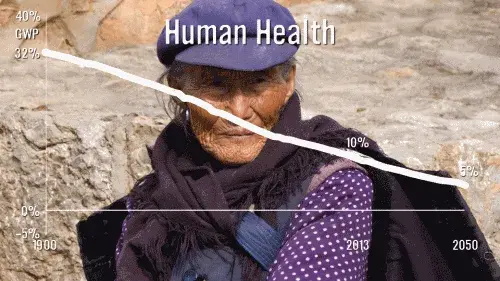
Economic terms give the clearest summary. The cost of poor health at the outset of the 20th century was a phenomenal 32% of global GDP. Today, it is down to about 11%, and by 2050 will have halved again.
Better health is excellent news by itself but a striking revelation of this study is that technical progress (like antibiotics, vaccinations and oral rehydration therapy) accounts for 68% of the massive recent improvement, while higher income accounts for only 3%; even having more doctors only accounts for 12%. This shows that poor people can leapfrog to better health, giving hope to billions.
Malnutrion
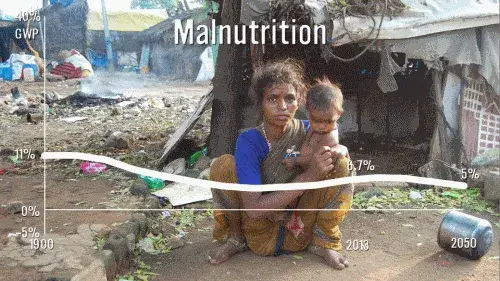
Hunger, one of humanity’s oldest scourges, has relented. The researchers measured it through height, a strong indicator of childhood starvation. In 1900, the average rich world male adult was just 169cm, and 164cm in the poor world -- now 177cm and 168cm. While a 4cm increase in the developing world may not sound like much, it indicates going from 10% moderate starvation to virtually nil, meaning 1.5 million fewer kids die each year from malnutrition.
The cost of malnutrition has almost halved from 11% of GDP in 1900 to 6% today, and should fall to 5% in 2050 -- magnificent progress but it also shows there is still much to do.
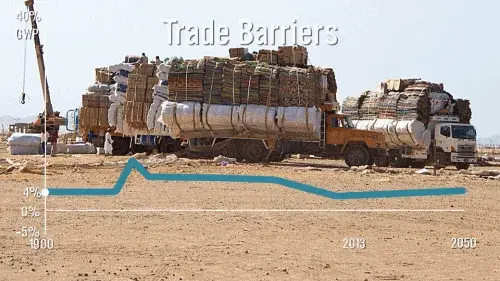
Trade barriers
International trade is a rarely on lists of top humanitarian problems. But with its rapid trade-driven growth in the past 30 years, China allowed 680 million people to lift themselves out of poverty.
Throughout much of the twentieth century, strong trade restrictions, like the agricultural barriers and subsidies in Europe and the USA, with import duties nearly everywhere, held back prosperity. The research reveals that more than half the cost to developing countries comes from their own policies: this sad fact also offers hope because unilateral action could reap half the potential benefits, without waiting for everyone else.
For the future, we can move towards more free trade and cut our annual losses to about half to 3% of GDP. But there is also a real risk of a return to the Thirties, again caused by recession, particularly among less-developed countries with most to lose.Doing nothing would keep growth in the developing world down at about 1.4% a year but concluding the World Trade Organization's currently stalled Doha Trade Round would add another 0.2% -- yielding global annual GDP in 2020 of about $5 trillion more, with $3 trillion going to the developing world.
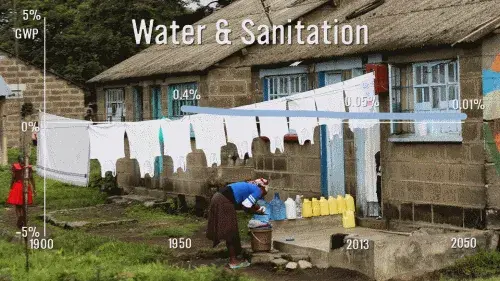
Water and sanitation
Water and sanitation are emotive headline topics that still cause 6–7% of deaths in developing countries -- yet progress has been and will be extraordinary: the death rate related to water and sanitation per 1,000 in developing countries was 1.5 in 1950, slashed to 0.4 today and again to 0.2 by mid-century. Although the rate is falling the numbers are still high: deaths by 2050 will likely still be around 1.7 million, mostly in sub-Saharan Africa, though down from 2.3 million today and 2.7 million of a much smaller population in 1950. It is great progress but still needs much more.
And progress does not just mean huge infrastructure projects: simple improvements such as chlorination or hand-washing reduce illness significantly, while piped water may make little difference if basic hygiene is not improved.
Measuring the impact in economic terms is not only about disease and death. This year, collecting water will take – mostly women – 74 billion hours, making up one-third of total losses. In all, the economic losses to developing world GDP from poor water and sanitation have already fallen from some 2% of GDP in 1950 (0.4% of GWP, because the developing world contributed with 1/5 of GWP) to 0.13% in 2013 (0.05% of GWP from about 35% of GWP). By mid-century losses will be down to just 0.02% (0.01% of GWP from maybe 60% of GWP).